Solve Problems Faster with New, Smarter AI and Integrations in Splunk Observability
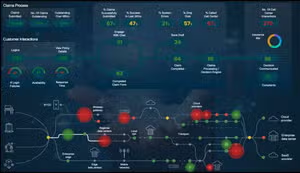
Observability Connor TyeAs businesses scale across hybrid and multi-cloud environments and integrate AI-powered technologies, complexity grows — and with it, the risk of performance degradation and cost of downtime. To avoid facing customer-impacting IT issues, organizations need better ways to correlate data across environments, detect anomalies before they escalate, and resolve incidents more efficiently. That’s where Splunk and Cisco come in. Bringing together ITOps and engineering teams with shared data, context, and workflows to help organizations detect, investigate, and resolve issues faster.
With our latest advancements, customers can stay ahead of the competition and solve problems more efficiently. Innovative AI-driven capabilities help teams troubleshoot faster by simplifying data exploration, proactively detecting anomalies before they escalate, and streamlining event management. We’re also delivering new integrations that extend visibility across applications, infrastructure, databases, and security for in-context troubleshooting and faster resolution. Ready to build a leading and AI-driven observability practice? Then these enhancements are for you.
Don’t Guess - Ask, Detect, and Resolve with AI
Whether you are optimizing performance or responding to incidents, Splunk’s AI-innovations are designed to simplify and accelerate troubleshooting. Lets dive into what's new and how it can help your team stay ahead of problems:
- AI Assistant in Observability Cloud: Splunk’s new AI Assistant in Observability Cloud, powered by agentic AI technology, is ready to help answer questions about your cloud application and infrastructure. Type in your prompts and the AI Assistant will analyze your logs, metrics, and trace data in seconds, surface key insights about potential root causes or performing gaps, and provide suggested actions to troubleshoot IT incidents. This AI Assistant is available in select realms in the US, Australia, and Europe. Get more details here, and check out how you can use the AI Assistant to debug problems in Kubernetes more quickly.

- ITSI 4.20 - Drift Detection: Drift Detection in Splunk ITSI helps catch sudden changes in KPIs before they are impacted and proactively determine slow, long-trending changes (like slowly increasing latency over months) that potentially indicate an issue, so it can be remediated before problems arise. Read more here.

-
ITSI 4.20 - Simplified Alert Onboarding (soon to be released): Powered by AI in Splunk ITSI, Simplified Alert Onboarding helps ITOps teams to easily get started with Event Analytics through an assisted workflow. It’s easy to ingest and transform alerts from Splunk & popular 3rd-party tools (like Nagios, SolarWinds, and Microsoft SCOM) with pre-built templates, automated, state-aware event correlations, including:
- Webhook integrations to send alert data & run alert actions between ITSI & 3rd-party integrations.
- The bidirectional Jira Cloud integration to send ITSI alerts to Jira.
- Event integration with Splunk Observability Cloud for more business service context and faster root cause analysis.

Respond Faster Across Apps, Infra, Databases, and Security
Modern IT environments comprising hybrid cloud architectures, distributed applications, and global databases have grown increasingly complex to manage. To address these challenges, Splunk with Cisco bring together new integrations, enabling more complete business visibility and faster remediation across our portfolio than ever before:
- AppDynamics Add-on and dedicated AppDynamics content pack (soon to be released): The integration of AppDynamics with Splunk ITSI helps enhance visibility and dynamically correlate applications and infrastructure with databases so you can quickly find problems and troubleshoot in-context. Read more details here, and access it directly on Splunkbase.
- AppDynamics Secure Application & Splunk Enterprise Security Integration: The new integration between AppDynamics’ Secure Application and Splunk Enterprise Security unifies visibility across ITOps and Security teams. By sending application attack data from Secure Application to the Splunk platform, teams can alert security analysts, accelerate application security investigation workflows, and quickly resolve issues.
For Splunk customers who want access to early insights or want to try some of these upcoming releases, sign up here and provide us valuable feedback.
Related Articles
Service Resilience - What Is It And Why Is It Needed?
BOO! Surprise Update to the Boss of the NOC Program